 With the recent release of the national Census data pundits have been quick to point out the obvious: the Latino population is growing! As if data points from the annual Current Population Survey, and now American Community Survey did not already tell us this on a yearly basis, the official 2010 decennial census now confirms that more than 50 million Latinos are part of America and politicians should take note. However, the lingering question on journalists minds is whether or not this population growth will transfer into immediate political power? With 33 U.S. Senate contests and a Presidential election across 50 states in 2012, the Latino voter is positioned to have a bigger impact than ever on the political landscape of America. However, even as the citizen eligible population is increasing rapidly, Latinos continue to face a registration gap vis-a-vis Whites and African Americans. Despite massive voter registration drives in 2008 and 2010, only about 60% of Latino citizen adults are registered to vote, compared to 70% of Blacks, and 74% of Whites. Thus, while the Latino population is growing dramatically (43% growth since 2000, compared to 1% growth in the White population), it’s influence in 2012 could be even greater than expected if voter registration drives take shape.
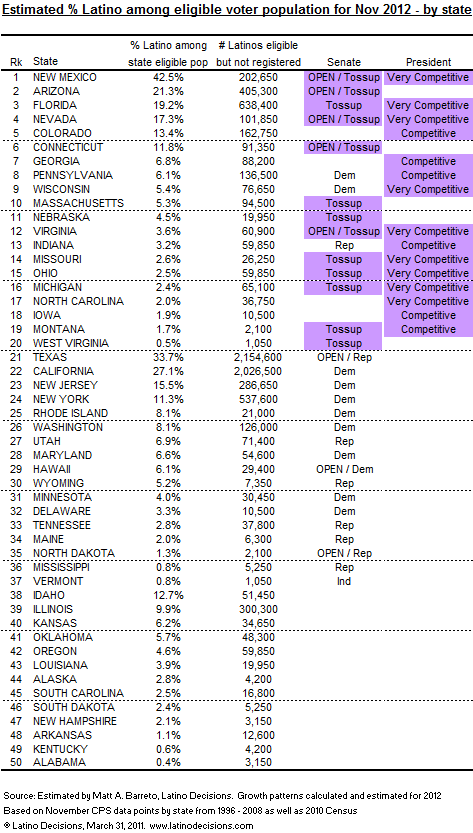
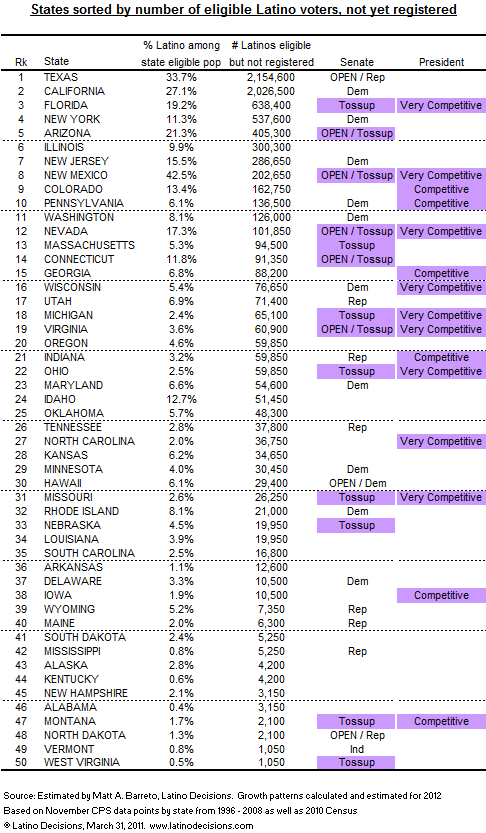
Using data from the 1996 – 2008 Current Population Survey, Voting and Registration supplement, and 2010 Census data where available, we have projected the Latino eligible voter population, by state for November 2012. Given the trends in growth rates over the previous decade, and new data from 2010, we project linear estimates for each state in 2012. By the 2012 election, Latinos will account for over 10% of the citizen adult population – potential voters – in 11 states. In another 13 states, Latino account for 5-10% of the citizen adult population. All told, that’s 24 states where Latinos have the capacity to influence electoral outcomes, given a competitive statewide election. In the table below, we outline the potential states where Latinos votes might matter in elections for U.S. Senate and President in 2012. For each state, we list the percentage of the total citizen adult eligible population that is Latino, as well as an estimate of how many eligible Latinos are not yet registered to vote. States are sorted by where Latinos are likely to have the most influence in 2012.

[ Click Here to see table above sorted by % Latino in state, largest-to-smallest ]
[ Click here for table of estimated % Latino among REGISTERED VOTERS in 2012 ]
In 2012, Latino voters have the best chance to influence outcomes in 10 states for either Senate, President, or both. Four of the top five states will be “Latino influence states” on everyone’s map – New Mexico, Florida, Nevada, Colorado all have large and growing Latino electorates in otherwise politically competitive states. In addition to close presidential contests, New Mexico, Florida and Nevada will likely see very competitive Senate elections. Another state we include, Arizona, has a large Latino population, and depending on who the nominees are for U.S. Senate, could have a fairly competitive election with Latino voters proving decisive. In 2010, Latinos registered voters in Arizona demonstrated the highest turnout rate of Latinos in any state.
The next batch of states that Latinos may influence are ones that historically are not obvious Latino states, but significant population growth over the last decade has left a substantial Latino eligible voter population. In Connecticut, Georgia, Pennsylvania, Wisconsin and Massachusetts, Latinos account for over 5% of potential voters, and each state is expected have a competitive U.S. Senate or Presidential contest in 2012. For example, in Georgia, the Latino population grew by 96% since 2000 while the White population grew by 6%; a state McCain won by just 5% (52-47) in 2008. In Wisconsin Latinos grew by 74% compared to 1% growth for Whites, and could be one of the most fiercely contested states in 2012.
Beyond these 10 states, there are others where Latinos will matter if elections are close, as expected in Nebraska, Virginia, Indiana, Missouri and Ohio. While the Latino population is a smaller percentage, the number of Latino citizen adults is growing rapidly, and with voter registration drives targeting potential Latino voters, we could very well be talking about the next “Latino upset” ala Reid vs. Angle in one of these five states. In Missouri the Latino population grew by 79% – 20 times faster than the White population (which grew by 4%), in a state that McCain won by just 4,000 total votes in 2008. One of the biggest keys to Latino influence in 2012 will not just be the population growth which has already occurred, but rather, voter registration drives that still need to occur.
Over 8 million more to be registered
Overall, we estimate 21.5 million Latino citizen adults will be eligible to vote in November 2012, up from 19.5 million in 2008. If registration rates remain constant, that will leave over 8 million Latino eligible voters who are not registered in 2012. With significant voter registration drives the Latino vote can go from influential to essential. In addition to the current Latino share of the citizen adult population in each state in the table above, we’ve also listed the estimated number of Latinos eligible to vote who are not registered, given growth rates. For example, while Latinos are growing in influence in Arizona, there are over 400,000 Latinos eligible to vote who are not yet registered. In Florida it’s even more – over 600,000 Latinos could be added to the voter rolls. Newly naturalized citizens and young Latinos turning 18 are adding literally a half-million of new potential voters each year.
Over the past decade, and well before, Latino civic and political organizations have led the charge in registering voters, as political parties rarely ventured into el barrio for campaign outreach. Groups such as NALEO, NCLR, Southwest Voter have invested millions of dollars and millions of hours into Latino voter registration and civic education drives. Today, many new and influential groups have emerged and done considerable work in Latino voter registration and mobilization including Mi Familia Vota, Democracia USA, The Hispanic Institute, and Voto Latino among many other groups. However, these non-partisan groups operate mostly on soft money contributions and an extensive volunteer network. A significant investment in Latino voter registration is badly overdue by both major political parties. In Texas, for example, there are an estimated 2.1 million Latino eligible voters who are not yet registered, who could be crucial to either party’s desire to win and hold statewide office in Texas in coming years. In California there are another 2 million eligible Latinos to be registered. There are 300,000 unregistered Latinos who could be voters in Illinois where a U.S. Senate election was decided by less than 60,000 votes in 2010.
As pundits look towards 2012, Latino voters are positioned to cast crucial votes in many states. Beyond looking at just the likely 4/4 voters, or perhaps the pool of registered voters, campaigns and candidates would be wise to look at the growing pool of Latino eligible voters and invest now in bringing more Latinos into the political system – an investment that will pay off for decades to come.

Dr. Matt Barreto is an associate professor of political science at the University of Washington, and director of the Washington Institute for the Study of Ethnicity and Race (WISER). He is also the co-Director of the Washington Poll, a statewide opinion survey conducted by Pacific Market Research. He received his Ph.D. in political science from the University of California, Irvine. His research examines the political participation of racial and ethnic minorities in the United States and his work has been published in the American Political Science Review, Political Research Quarterly, Public Opinion Quarterly, Urban Affairs Review, and other peer reviewed journals.
Barreto specializes in Latino and immigrant voting behavior, and teaches courses on Racial and Ethnic Politics, Latino Politics, and Voting and Elections at UW. He is also an affiliated faculty member in the Center for Statistics and the Social Sciences (CSSS) at the University of Washington, and is an affiliated research scholar with the Tomás Rivera Policy Institute and with the Center for the Study of Los Angeles. In 2004, Barreto was a co-author of the TRPI/Washington Post National Survey of Latino voters, and in 2006 he was a principal advisor and survey consultant to the Latino Policy Coalition which conducted four nationwide surveys of Latino voters during the midterm elections. In 2008, Barreto and Segura were the co-principal investigators of the American National Election Study (ANES) Latino oversample, which extended the 60 year old ANES study to Latinos, and for the first time offered the survey in Spanish.
He can be reached at: matt.barreto@latinodecisions.com
The opinions expressed in this commentary are solely those of its author and do not necessarily reflect those of Latinovations or the Dewey Square Group.

By 2012, The National Popular Vote bill could guarantee the Presidency to the candidate who receives the most popular votes in all 50 states (and DC).
Every vote, everywhere would be politically relevant and equal in presidential elections. Elections wouldn’t be about winning states. Every vote, everywhere would be counted for and directly assist the candidate for whom it was cast. Candidates would need to care about voters across the nation, not just undecided voters in a handful of swing states.
In the 2012 election, pundits and campaign operatives already agree that only 14 states and their voters will matter under the current winner-take-all laws (i.e., awarding all of a state’s electoral votes to the candidate who receives the most popular votes in each state) used by 48 of the 50 states. Candidates will not care about 72% of the voters- voters-in 19 of the 22 lowest population and medium-small states, and big states like CA, GA, NY, and TX. 2012 campaigning would be even more obscenely exclusive than 2008 and 2004. Candidates have no reason to poll, visit, advertise, organize, campaign, or care about the voter concerns in the dozens of states where they are safely ahead or hopelessly behind. Policies important to the citizens of ‘flyover’ states are not as highly prioritized as policies important to ‘battleground’ states when it comes to governing.
Since World War II, a shift of a handful of votes in one or two states would have elected the second-place candidate in 4 of the 13 presidential elections. Near misses are now frequently common. There have been 6 consecutive non-landslide presidential elections. 537 popular votes won Florida and the White House for Bush in 2000 despite Gore’s lead of 537,179 popular votes nationwide. A shift of 60,000 votes in Ohio in 2004 would have defeated President Bush despite his nationwide lead of over 3 Million votes.
The bill would take effect only when enacted, in identical form, by states possessing a majority of the electoral votes–enough electoral votes to elect a President (270 of 538). When the bill comes into effect, all the electoral votes from those states would be awarded to the presidential candidate who receives the most popular votes in all 50 states (and DC).
The bill uses the power given to each state by the Founding Fathers in the Constitution to change how they award their electoral votes for president.
The bill has been endorsed by organizations such as the League of Women Voters, Common Cause, FairVote, Sierra Club, NAACP, National Black Caucus of State Legislators, ACLU, the National Latino Congreso, Asian American Action Fund, DEMOS, National Coalition on Black Civic Participation, Public Citizen, U.S. PIRG, and the Brennan Center for Justice.
In Gallup polls since 1944, only about 20% of the public has supported the current system of awarding all of a state’s electoral votes to the presidential candidate who receives the most votes in each separate state (with about 70% opposed and about 10% undecided). Support for a national popular vote is strong in virtually every state, partisan, and demographic group surveyed in recent polls in closely divided battleground states: CO – 68%, FL – 78%, IA 7-5%,, MI – 73%, MO – 70%, NH – 69%, NV – 72%, NM– 76%, NC – 74%, OH – 70%, PA – 78%, VA – 74%, and WI – 71%; in smaller states (3 to 5 electoral votes): AK – 70%, DC – 76%, DE – 75%, ID – 77%, ME – 77%, MT – 72%, NE 74%, NH – 69%, NV – 72%, NM – 76%, OK – 81%, RI – 74%, SD – 71%, UT – 70%, VT – 75%, WV – 81%, and WY – 69%; in Southern and border states: AR – 80%,, KY- 80%, MS – 77%, MO – 70%, NC – 74%, OK – 81%, SC – 71%, VA – 74%, and WV – 81%; and in other states polled: CA – 70%, CT – 74%, MA – 73%, MN – 75%, NY – 79%, OR – 76%, and WA – 77%.
The bill has passed 31 state legislative chambers, in 21 small, medium-small, medium, and large states, including one house in AR, CT, DE, DC, ME, MI, NV, NM, NY, NC, and OR, and both houses in CA, CO, HI, IL, NJ, MD, MA, RI, VT, and WA. The bill has been enacted by DC, HI, IL, NJ, MD, MA, and WA. These 7 states possess 74 electoral votes — 27% of the 270 necessary to bring the law into effect.
http://www.NationalPopularVote.com